一、echarts 通用图表封装
场景:在统计场景下,图表必不可少,那怎么去有效的封装图表组件就是一个需要仔细考量的问题,不然就是各写各的,相同的图表组件很容易存在多个情况,代码冗余且混乱。
图表封装主要考虑几个问题:
- 默认的样式和自定义传入的样式怎么共存
- 当数据发生变化时,如何刷新图表数据
- 当视口发生变化时,如何动态的改变图表大小
1. 默认的样式和自定义传入的样式怎么共存
主要思路:合并配置
具体:将传入的配置参数与图表中默认的配置参数,进行一次相同key的覆盖操作,如果没有则使用默认参数,如果传入则优先使用自定义参数。
- 方案一:核心工具类js
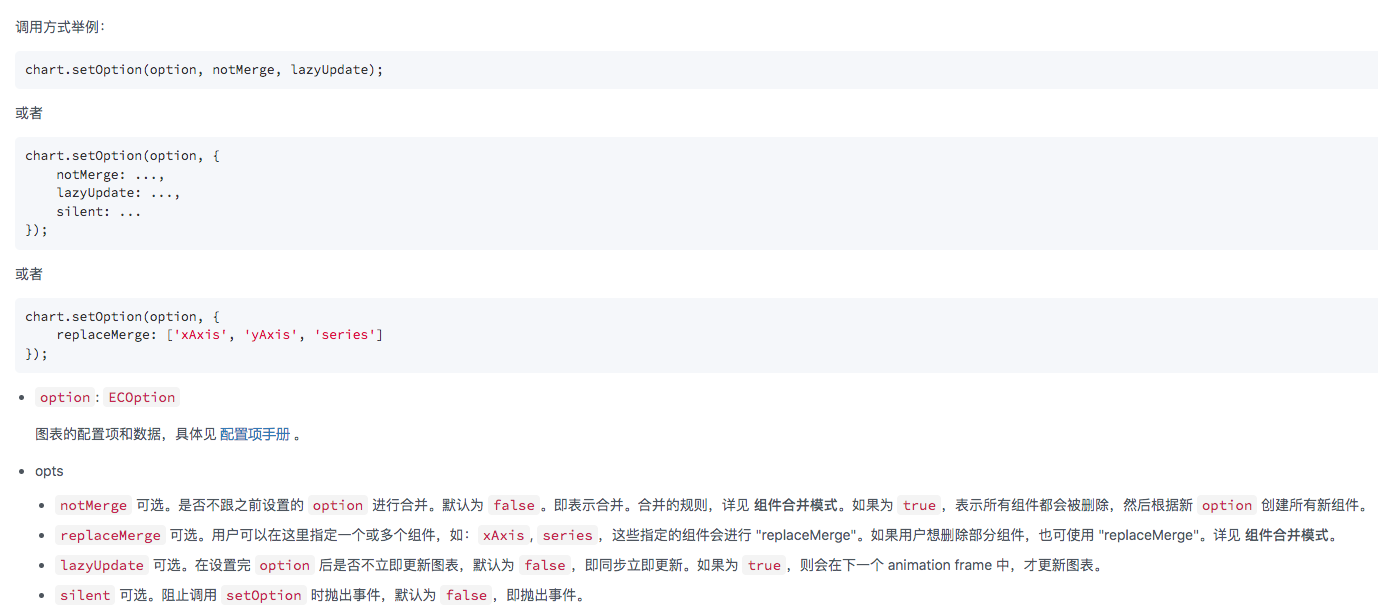
/** * 判读是不是Object * @param value * @return {boolean} */ const isObject = (value) => { const type = typeof value; return value !== null && (type === "object" || type === "function"); }; /** * 合并两个对象, * 如果没有则默认第一个对象的值 * 相同则覆盖 * @param source 源对象 * @param other 需要合并的对象 * @return {*[]|*} */ export const mergeObject = (source, other) => { if (!isObject(source) || !isObject(other)) { return other === undefined ? source : other; } // 合并两个对象的 key,另外要区分数组的初始值为 [], 否则原样输出 return Object.keys({ ...source, ...other, }).reduce( (acc, key) => { // 递归合并 value acc[key] = mergeObject(source[key], other[key]); return acc; }, Array.isArray(source) ? [] : source ); }; - 方案二: 利用 echarts 自带的 setOption API中的 notMerge 参数进行设置,具体参考:

2. 当数据发生变化时,如何刷新图表数据
- echarts 提供了 setOption API,当数据发生改变时,调用该 API 即可
- 基于 vue 的话,就需要使用 watch 监听函数了,比较优雅的方式就是,传入一个tag,监听这个 tag 即可,无需监听一个数据对象
3. 当视口发生变化时,如何动态的改变图表大小
- 使用 ResizeObserver 和 echarts 自带的 resize API
- 具体参考: 当ECharts遇到ResizeObserver
4. 详细代码实现
- 需要自定义的配置使用vue
<template>
  <div ref="circular"/>
</template>

<script>
// 引入 echarts 核心模块,核心模块提供了 echarts 使用必须要的接口。
import * as echarts from "echarts/core";
// 引入柱状图图表
import { PieChart } from "echarts/charts";
// 引入 Canvas 渲染器,注意引入 CanvasRenderer 或者 SVGRenderer 是必须的一步
import { SVGRenderer } from "echarts/renderers";
// 引入提示框,标题,直角坐标系,数据集,内置数据转换器组件,组件后缀都为 Component
import { TooltipComponent, LegendComponent } from "echarts/components";
import { mergeObject } from "@/utils/MergeObject";
// 注册必须的组件
echarts.use([TooltipComponent, LegendComponent, PieChart, SVGRenderer]);

export default {
  name: "Circular",
  props: {
    legendData: {
      type: Array,
      default: () => {
        return ["数据源一", "数据源二", "数据源三"];
      },
    },
    seriesData: {
      type: Array,
      default: () => {
        return [
          { value: 100, name: "数据源一" },
          { value: 200, name: "数据源二" },
          { value: 300, name: "数据源三" },
        ];
      },
    },
    colors: {
      type: Array,
      default: () => {
        return ["#FFBD2B", "#0FF1FF", "#2F8FFF"];
      },
    },
    text: {
      type: String,
      default: "总计",
    },
    total: {
      type: Number,
      default: 0,
    },
    specialOptions: {
      type: Object,
      default: () => {},
    },
    // watch对数组的监听及其不友好,数据响应慢了直接监听不到
    tag: Boolean,
  },
  data() {
    return {
      circular: {},
    };
  },
  watch: {
    tag: {
      handler() {
        this.setChartOptions();
      },
    },
  },
  mounted() {
    this.initCharts().then((res) => {
      this.circular = res;
      this.resizeChart();
      this.setChartOptions();
    });
  },
  methods: {
    initCharts() {
      // There is a chart instance already initialized on the dom.
      return new Promise((resolve) => {
        const circular = echarts.init(this.$refs.circular, { renderer: "svg" });
        resolve(circular);
      });
    },
    setChartOptions() {
      // 统一配置
      const commonOption = {
        legendOptions: {
          // right: "10%",
          top: "16%",
          orient: "vertical",
          icon: "circle",
          itemHeight: 8,
          formatter: (name) => {
            const data = options.series[0].data;
            let tarValue = "";
            for (let i = 0; i < data.length; i++) {
              if (data[i].name == name) {
                tarValue = data[i].value;
              }
            }
            const arr = ["{a|" + name + "}{b|(" + tarValue + ")}"];
            return arr.join("\n");
          },
          textStyle: {
            rich: {
              a: {
                fontSize: 12,
                width: 80,
                color: "#fff",
              },
              b: {
                width: 60,
                // align: "left",
                fontSize: 12,
                fontWeight: 500,
                color: "#fff",
              },
            },
          },
        },
        rich: {
          a: {
            fontFamily: "Poppins",
            fontWeight: 600,
            fontSize: 16,
            color: "#fff",
            align: "center",
          },
          b: {
            padding: [5, 0, 0, 0],
            align: "center",
            fontSize: 10,
            color: "#fff",
          },
          c: {
            fontFamily: "Poppins",
            fontWeight: 600,
            fontSize: 12,
            color: "#6BE9FC",
            align: "center",
          }
        },
      };
      // 总体配置
      let options = {
        legend: {
          data: this.legendData,
          ...commonOption.legendOptions,
        },
        series: [
          {
            type: "pie",
            radius: ["60%", "80%"],
            avoidLabelOverlap: false,
            label: {
              show: true,
              position: "center",
              formatter: () => {
                let formatters = [`{a|${this.total}}\n{b|${this.text}}`]
                if (this.total === 0) {
                  formatters = [`{c|${this.text}}`]
                }
                return formatters;
              },
              rich: commonOption.rich,
            },
            labelLine: {
              show: false,
            },
            data: this.seriesData,
            color: this.colors,
          },
        ],
      };
      // 合并自定义配置
      options = mergeObject(options, this.specialOptions);
      this.circular.setOption(options);
    },
    resizeChart() {
      const resizeObserver = new ResizeObserver(() => {
        const width = this.$refs.circular?.offsetWidth;
        this.circular.resize({ width, height: "auto" });
      });
      resizeObserver.observe(this.$refs.circular);
    },
  },
};
</script>