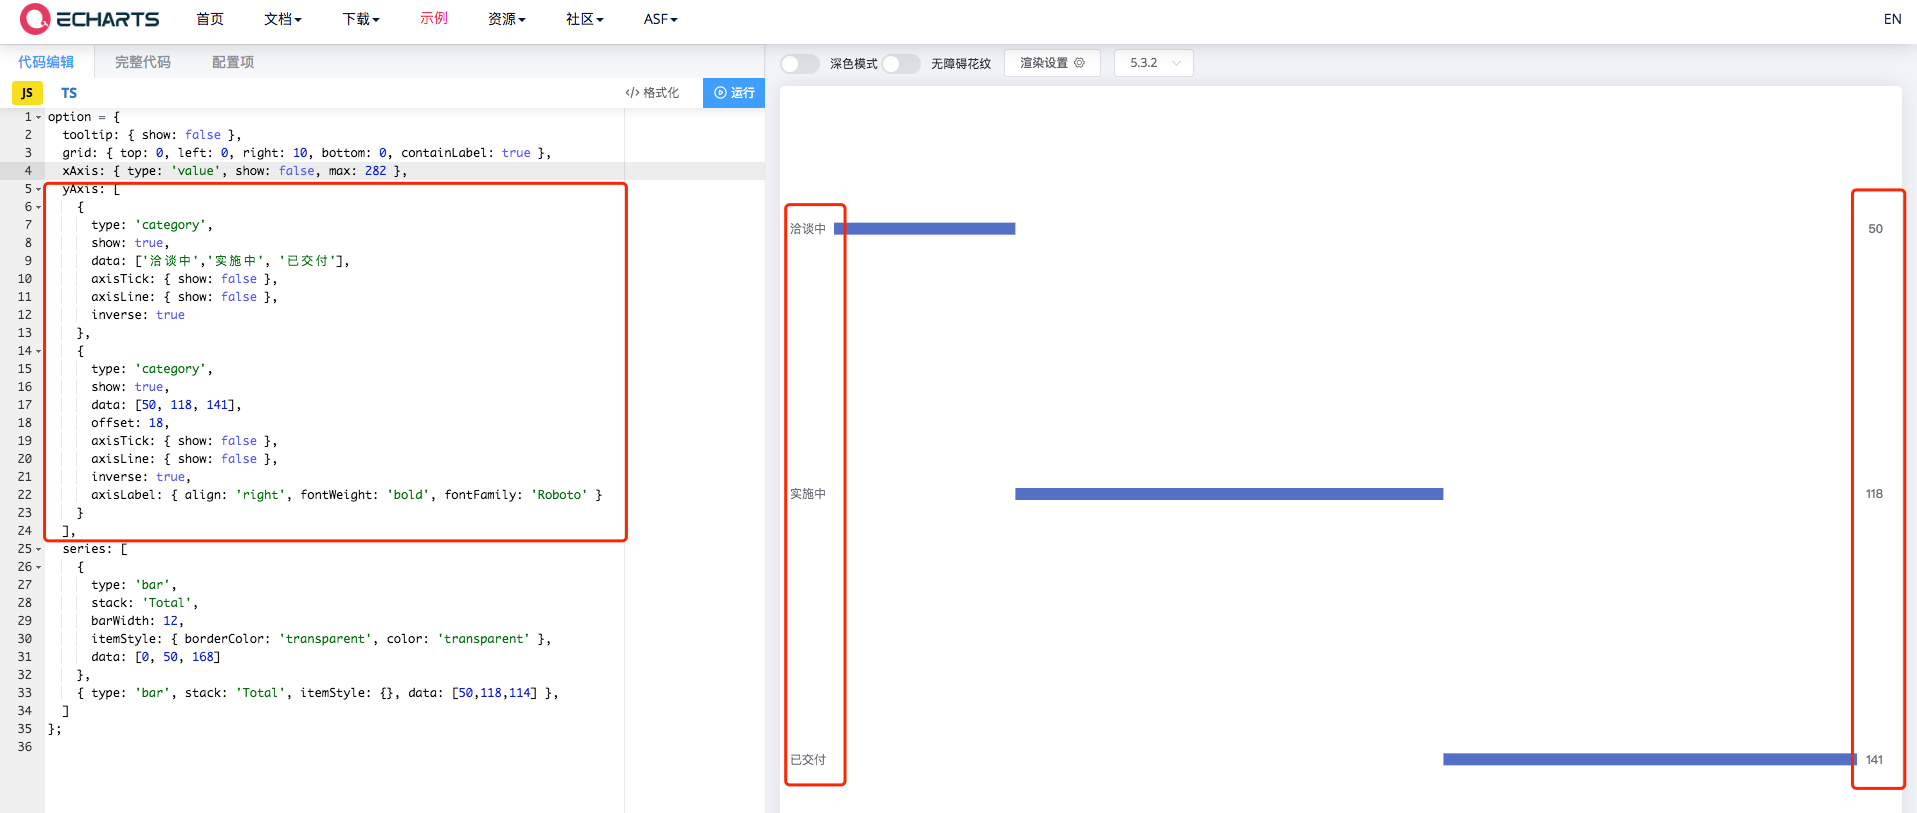
一、ECharts-双坐标
场景:在图表统计过程中,会遇到需要双坐标的场景
1.具体现象
效果

配置代码
json5{ tooltip: { show: false }, grid: { top: 0, left: 0, right: 10, bottom: 0, containLabel: true }, xAxis: { type: 'value', show: false, max: 282 }, yAxis: [ { type: 'category', show: true, data: ['洽谈中','实施中', '已交付'], axisTick: { show: false }, axisLine: { show: false }, inverse: true }, { type: 'category', show: true, data: [50, 118, 141], offset: 18, axisTick: { show: false }, axisLine: { show: false }, inverse: true, axisLabel: { align: 'right', fontWeight: 'bold', fontFamily: 'Roboto' } } ], series: [ { type: 'bar', stack: 'Total', barWidth: 12, itemStyle: { borderColor: 'transparent', color: 'transparent' }, data: [0, 50, 168] }, { type: 'bar', stack: 'Total', itemStyle: {}, data: [50,118,114] }, ] }