一、绘制多条线
1. 多条线
- 数据结构json5
{ "type": "FeatureCollection", "features": [ { "type": "Feature", "properties": {}, "geometry": { "type": "LineString", "coordinates": [ [ 93.55957031249999, 41.21172151054787 ], [ 93.955078125, 29.267232865200878 ], [ 103.7548828125, 29.916852233070173 ] ] } } ] } - 在
geojson.io上显示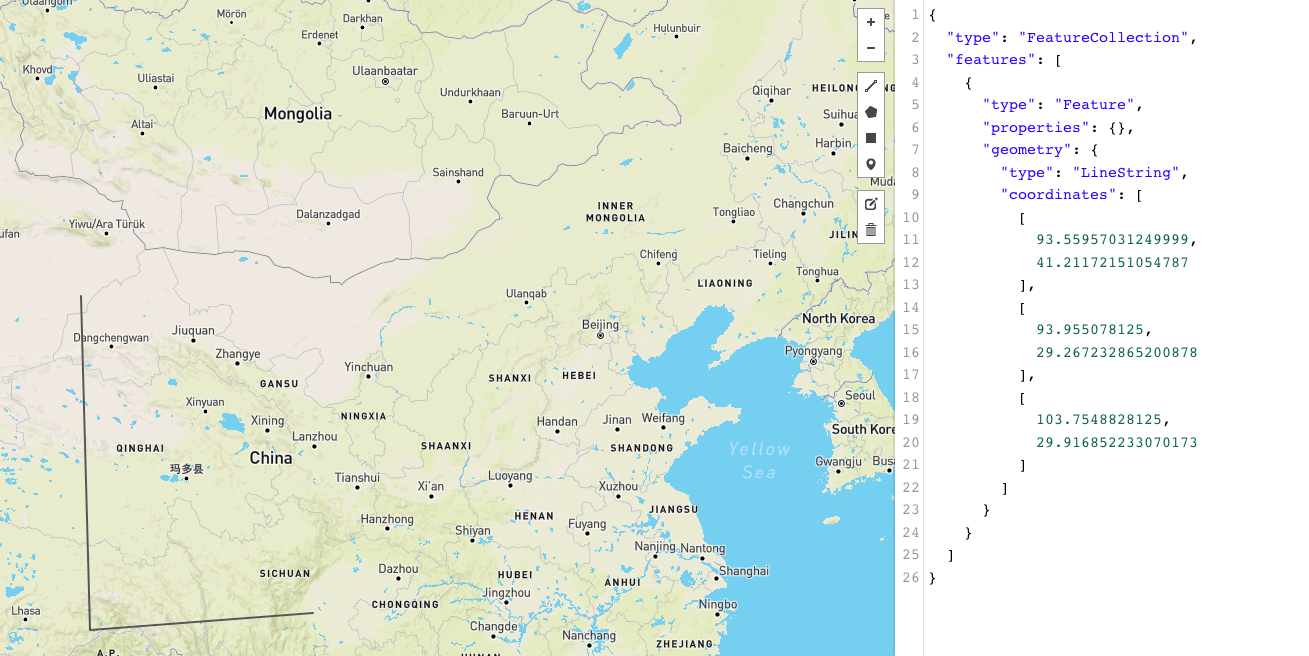
二、绘制多线条
1. 核心代码
- 数据解析js
/** * 处理地图经纬度数据 */ initMultipleLine() { this.#mapData?.features?.map(item => { const areas = item.geometry.coordinates; const areaVector = { coordinates: [] }; areas.map(area => { areaVector.coordinates.push(this.lnglatToVector(area)) }) this.#vector3Json.push(areaVector); }) // 绘制模块 const group = new Group(); this.#vector3Json.map(vector => { const mesh = this.drawLine(vector.coordinates); group.add(mesh); }) this.scene.add(group); } - 绘制线条js
  /**
   * 绘制线条
   */
  drawLine(points = [])
  {
    const geometry = new BufferGeometry();
    const pointsTotal = []
    points.map(point => {
      pointsTotal.push(...point)
    })
    const vertices = new Float32Array(pointsTotal);
    // 写法一:
    geometry.setAttribute('position', new BufferAttribute(vertices, 3))
    // 写法二:
    // geometry.setAttribute('position', new Float32BufferAttribute(vertices, 3))

    // 材质
    const material = new LineBasicMaterial({
      color: "#007cff",
      transparent: true,
      opacity: 0.5,
    });
    // 合并
    const mesh = new Line(geometry, material);
    return mesh;
  }
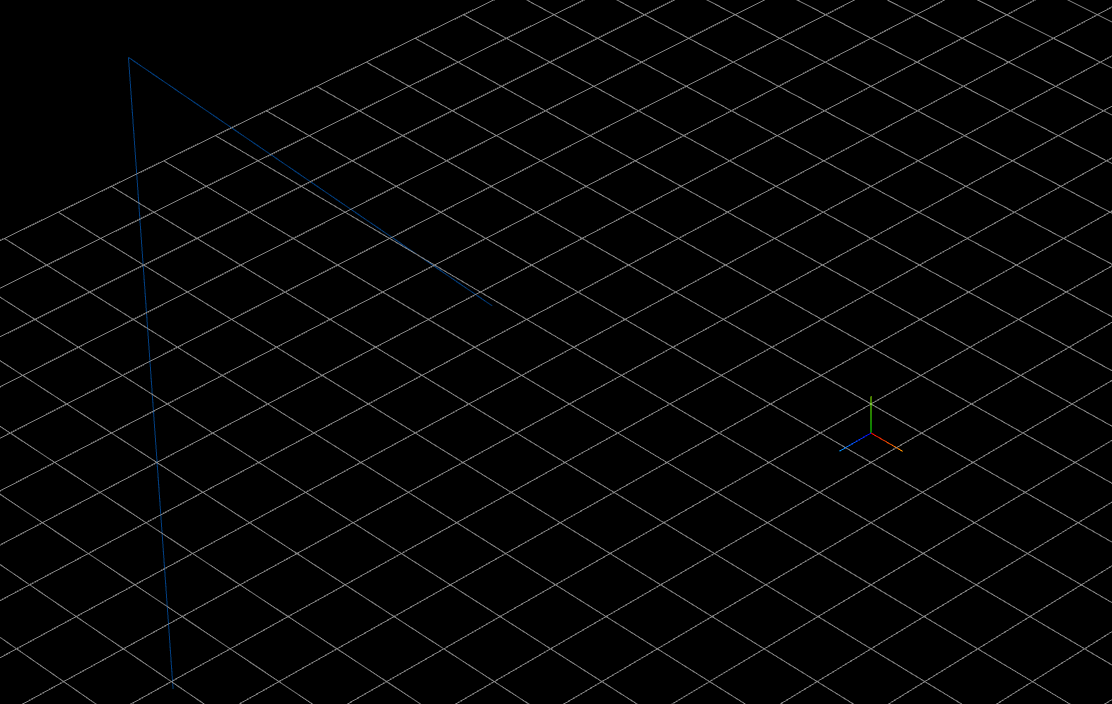
2. 完整示例
代码示例
jsimport ThreeBase from "./ThreeBase"; import * as D3 from 'd3-geo'; import axios from "axios"; import {Group, LineBasicMaterial, Line, BufferGeometry, BufferAttribute} from 'three'; /** * 绘制多条线 */ export default class ThreeMultiplePolygonMap extends ThreeBase { #projection; #mapData; #vector3Json = []; constructor() { super(); } initMapData() { return axios.get('geojson/line.json').then(res => { this.#mapData = res.data; }) } initObj() { this.initMapData().then(() => { this.initMultipleLine() }) } /** * 绘制线条 */ drawLine(points= []) { const geometry = new BufferGeometry(); const pointsTotal = [] points.map(point => { pointsTotal.push(...point) }) const vertices = new Float32Array(pointsTotal); geometry.setAttribute('position', new BufferAttribute(vertices, 3)) // 材质 const material = new LineBasicMaterial({ color: "#007cff", transparent: true, opacity: 0.5 }); // 合并 const mesh = new Line(geometry, material); return mesh; } /** * 处理地图经纬度数据 */ initMultipleLine() { this.#mapData?.features?.map(item => { const areas = item.geometry.coordinates; const areaVector = { coordinates: [] }; areas.map(area => { areaVector.coordinates.push(this.lnglatToVector(area)) }) this.#vector3Json.push(areaVector); }) // 绘制模块 const group = new Group(); this.#vector3Json.map(vector => { const mesh = this.drawLine(vector.coordinates); group.add(mesh); }) this.scene.add(group); } lnglatToVector(lnglat) { if (!this.#projection) { this.#projection = D3.geoMercator() .center([112.946332, 28.236672]) .scale(400) .translate([0,0]); } const [y, x] = this.#projection([...lnglat]); const z = 0; return [y, x, z]; } }效果展示