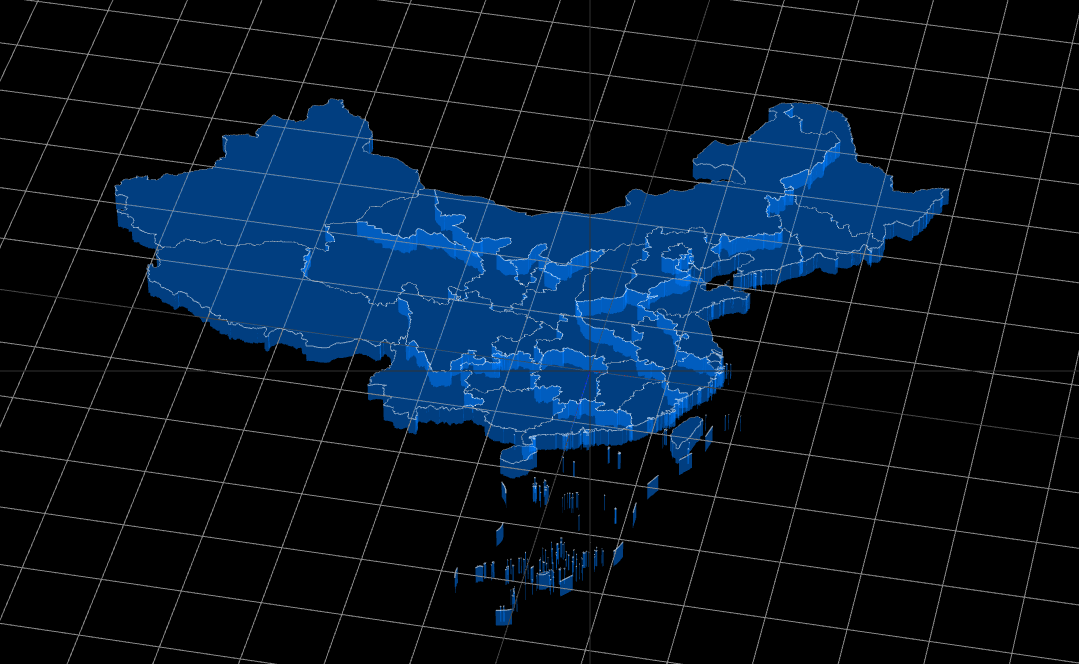
一、threejs地图-绘制中国地图区域边框
1. 边框
- 前面已经绘制过多条线,原理上雷同
2. 核心代码
- 绘制线条javascript
/** * 绘制线条 */ drawLine(points= []) { const geometry = new BufferGeometry(); const pointsTotal = [] points.map(point => { pointsTotal.push(...point) }) const vertices = new Float32Array(pointsTotal); // geometry.setAttribute('position', new BufferAttribute(vertices, 3)) geometry.setAttribute('position', new Float32BufferAttribute(vertices, 3)) // 材质 const material = new LineBasicMaterial({ color: "#fff", transparent: true, opacity: 0.5, }); // 合并 const mesh = new Line(geometry, material); return mesh; } - 加入
group中
3. 完整代码
js
import * as D3 from 'd3-geo';
import axios from "axios";
import {
  Group,
  Shape,
  ExtrudeGeometry,
  MeshBasicMaterial,
  Mesh,
  BufferGeometry,
  Float32BufferAttribute,
  LineBasicMaterial,
  Line,
} from 'three';

import ThreeBase from "./ThreeBase";


const MULTI_POLYGON  = 'MultiPolygon';
const POLYGON = 'Polygon'
/**
 * 绘制多多边形
 */
export default class ThreeChinaLineMap extends ThreeBase{

  #projection;
  #mapData;
  #vector3Json = [];

  constructor() {
    super();
  }

  initObj() {
    this.initMapData().then(() => {
      this.initChinaMap()
    })
  }

  initMapData() {
    return axios.get('geojson/china.json').then(res => {
      this.#mapData = res.data;
    })
  }

  /**
   * 绘制网格
   */
  drawChina(points= []) {
    const shape = new Shape();
    points?.map((point, index) => {
      const [x, y] = point;
      if (index === 0) {
        shape.moveTo(x, y);
      } else if (index === points.length - 1) {
        // 二次曲线
        shape.quadraticCurveTo(x, y, x, y)
      } else {
        shape.lineTo(x, y, x, y)
      }
    })
    // bevelEnabled 是否启用斜角
    const geometry = new ExtrudeGeometry(
      shape, {
        depth: 0.5, bevelEnabled: false
      }
    )
    // 材质
    const material = new MeshBasicMaterial({
      color: "#007cff",
      transparent: true,
      opacity: 0.5
    });

    // 合并
    const mesh = new Mesh(geometry, material);
    return mesh;
  }

  /**
   * 绘制线条
   */
  drawLine(points= []) {
    const geometry = new BufferGeometry();
    const pointsTotal = []
    points.map(point => {
      pointsTotal.push(...point)
    })
    const vertices = new Float32Array(pointsTotal);
    // geometry.setAttribute('position', new BufferAttribute(vertices, 3))
    geometry.setAttribute('position', new Float32BufferAttribute(vertices, 3))

    // 材质
    const material = new LineBasicMaterial({
      color: "#fff",
      transparent: true,
      opacity: 0.5,
    });
    // 合并
    const mesh = new Line(geometry, material);
    return mesh;
  }

  /**
   * 处理地图经纬度数据
   */
  initChinaMap() {
    this.#mapData?.features?.map((item) => {
      const areas = item.geometry.coordinates;
      const type = item.geometry.type;
      const areaVector = { ...item.properties, coordinates: [] };
      areas.map((area, index) => {
        if (type === POLYGON) {
          areaVector.coordinates[index] = [];
          area.map((point) => {
            areaVector.coordinates[index].push(this.lnglatToVector(point))
          })
        } else if (type === MULTI_POLYGON) {
          areaVector.coordinates[index] = [];
          area.map((point) => {
            point?.map(pointInner => {
              areaVector.coordinates[index].push(this.lnglatToVector(pointInner))
            })
          })
        }
      })
      this.#vector3Json.push(areaVector);
    })
    // 绘制模块
    const group = new Group();
    this.#vector3Json.map(vectors => {
      vectors.coordinates.map(vector => {
        const mesh = this.drawChina(vector);
        const line = this.drawLine(vector)
        group.add(line);
        group.add(mesh);
      })
    })
    group.rotation.y = Math.PI;
    group.rotateX(Math.PI / 2);
    group.rotateZ(Math.PI)
    this.scene.add(group);
  }

  /**
   * 将 经纬度 转成 空间坐标
   * @param lnglat
   * @return {(*|number)[]}
   */
  lnglatToVector(lnglat) {
    if (!this.#projection) {
      this.#projection = D3.geoMercator()
        .center([112.946332, 28.236672])
        .scale(20)
        .translate([0,0]);
    }
    const [y, x] = this.#projection([...lnglat]);
    const z = 0;
    return [y, x, z];
  }
}
4. 效果演示